
Structured Trading Coaching
The Traders Mastermind
Inner Circle
A complete trading education membership for serious developing traders.
Why the Inner Circle Exists
Many traders struggle because their education is fragmented.
They may learn a pattern from one place, a setup from another, a risk rule from somewhere else, and then try to combine everything without a proper structure.
This usually leads to confusion, inconsistency, and emotional decision-making.
The Inner Circle solves this by bringing the key parts of trader development into one structured environment:
- How to read the chart
- How to build a trading process
- How to manage risk
- How to review performance
- How to improve decision-making
- How to become more consistent over time
It is not built around hype, signals, or promises of quick profits.
It is built around education, process, and trader development.
Who Is This For?
The Inner Circle is suitable for traders who want more than basic trading content.
It is designed for:
- Newer traders who want a proper structure from the beginning
- Developing traders who already understand basic charting but feel inconsistent
- Traders who jump between strategies and want a clearer process
- Traders who struggle with trade selection, risk, or discipline
- Traders who want access to both technical analysis and strategy-development education
- Traders who want recordings and templates they can revisit in their own time
- Traders who want a practical learning environment without unrealistic promises
This membership is not designed for people looking for guaranteed returns, signals, or shortcuts.
What Members Get Each Month
Inner Circle members receive access to:
- Two Technical Blueprint sessions per month
- Two Strategist sessions per month
- Access to Technical Blueprint recordings
- Access to Strategist recordings
- Access to selected historical session recordings
- Worksheets, templates, and practical resources
- Structured education around technical analysis, trading systems, and trade management
- A growing education library
- Access to the broader Traders Mastermind learning environment
This gives members a more complete development path compared to joining only one individual pathway.
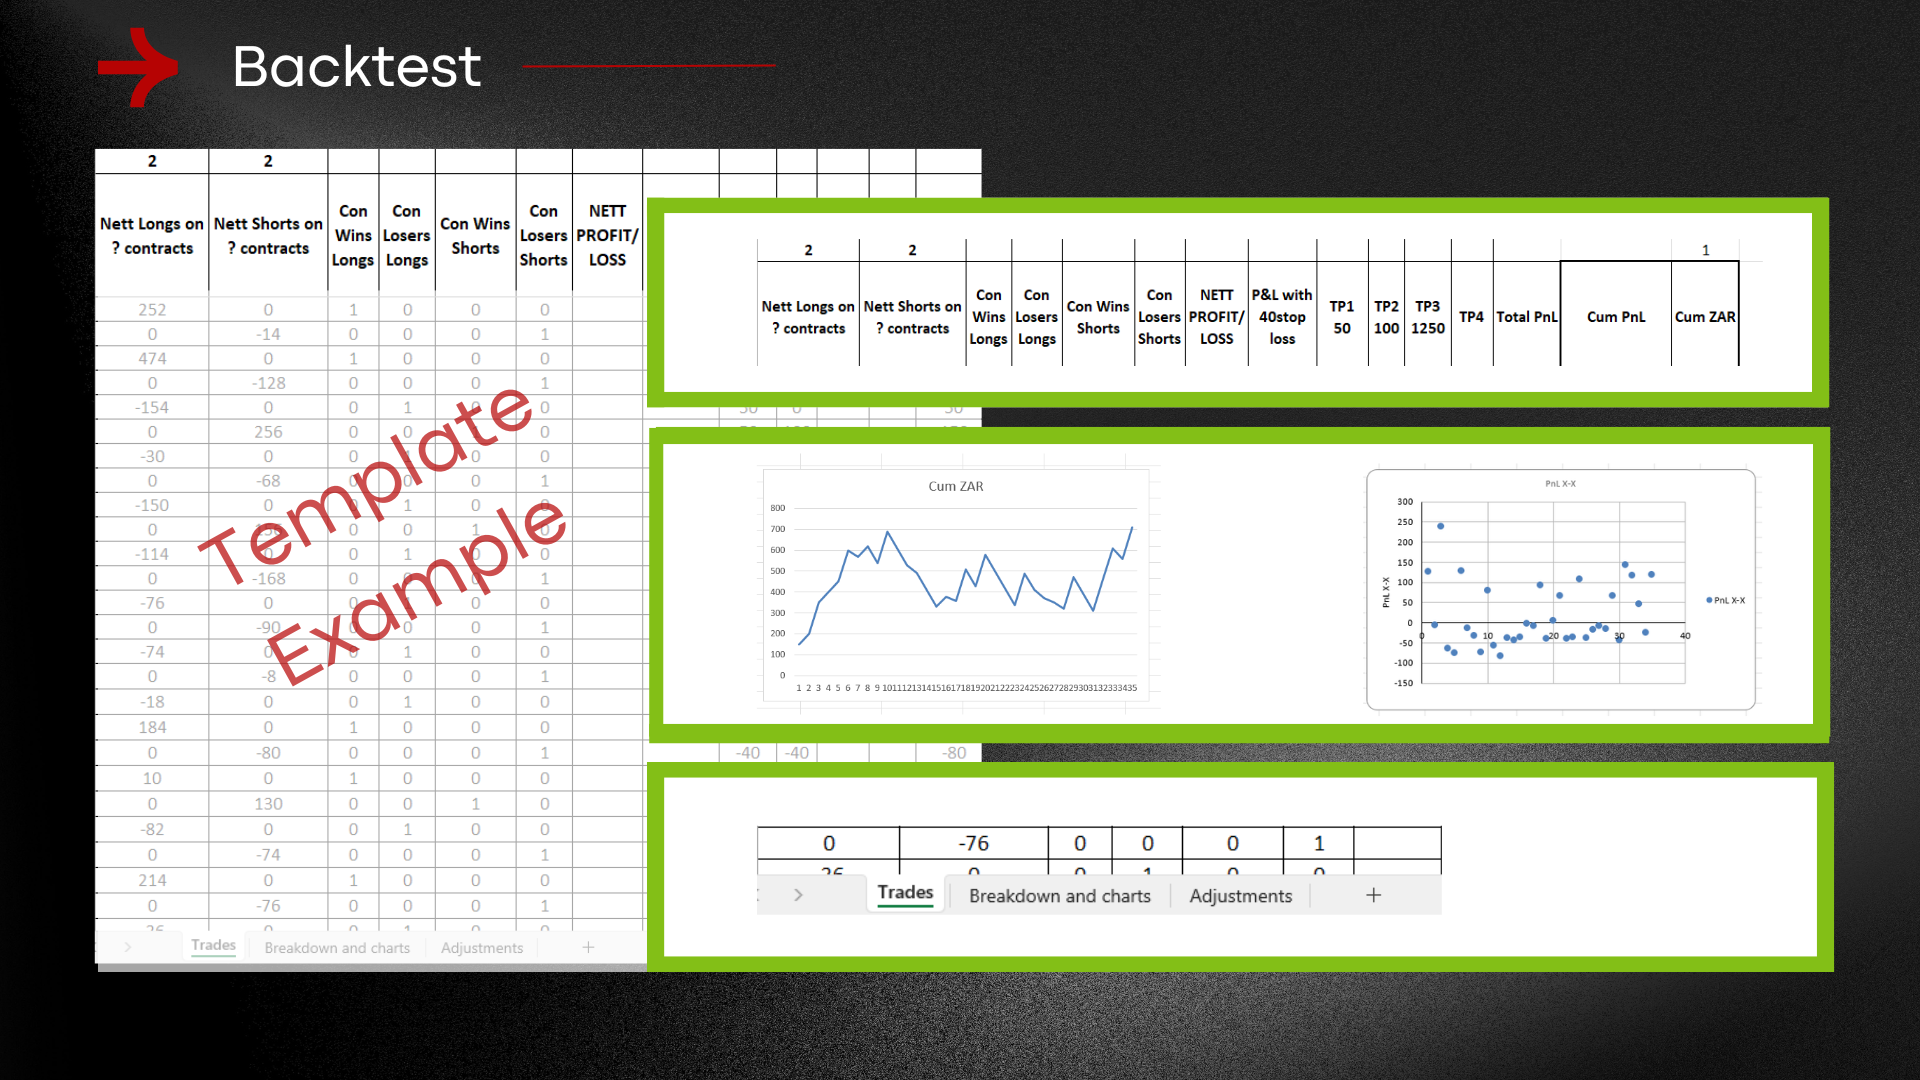
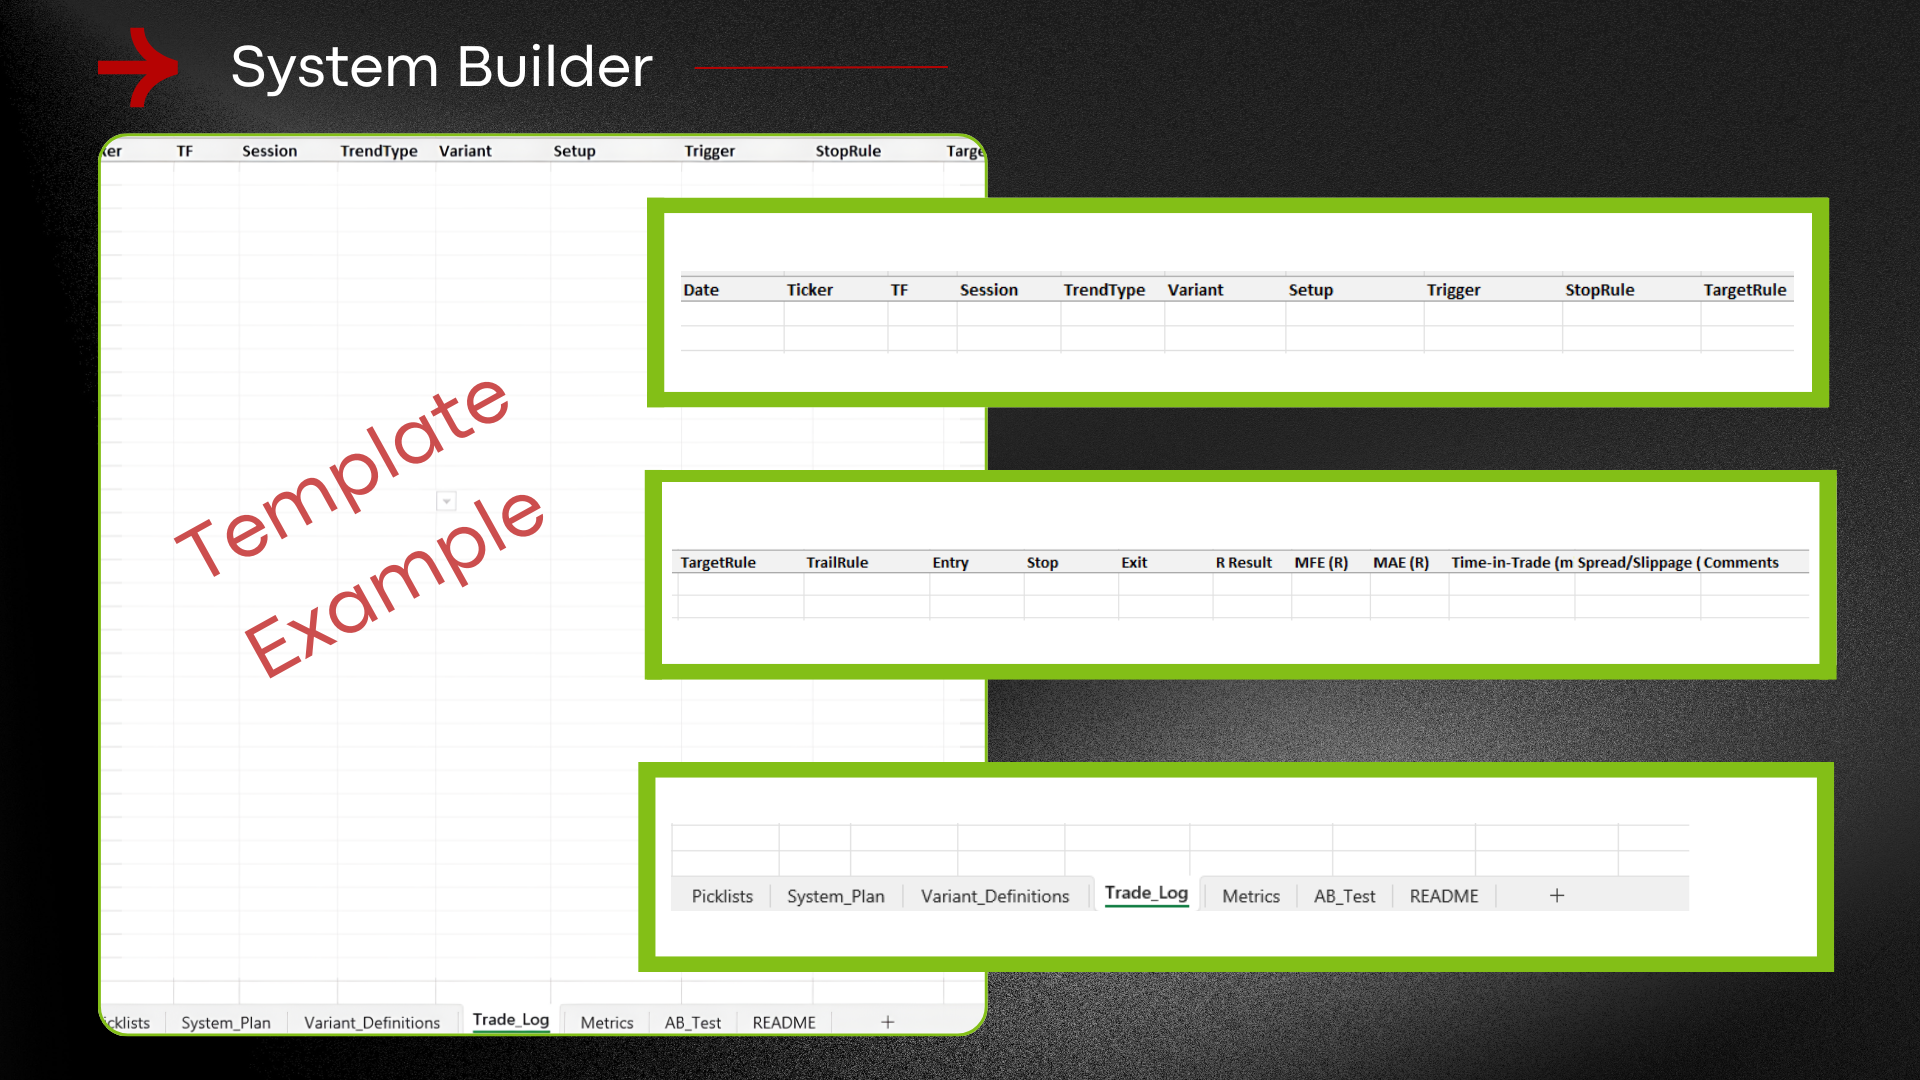
The Traders Mastermind Templates
What the Inner Circle Includes
Technical Blueprint
The Technical Blueprint is the chart-reading and technical analysis pathway inside The Traders Mastermind.
It is designed to help traders build a clearer process for reading markets, identifying structure, understanding price behaviour, and improving trade selection.
Each month includes two Technical Blueprint sessions:
and
Strategist Sessions
The Strategist sessions are focused on the practical side of trading: systems, strategy design, risk management, trade planning, execution, review, and improvement.
Where the Technical Blueprint focuses mainly on reading the chart, the Strategist sessions focus on what the trader does with that information.
Each month includes:
Building and testing trading rules
Trade management
Position sizing
Risk control
Stop placement
Profit-taking methods
Journaling and performance review
Strategy refinement
Mistake reduction
Process improvement
Market preparation
Trader behaviour and discipline
Inner Circle vs Individual Memberships
Technical Blueprint
Includes:
Two Technical Blueprint sessions per month
Technical analysis education
Chart-reading development
Technical Blueprint recordings
vs
Strategist Sessions
Best for traders who want to improve their trading process, strategy design, risk management, and execution.
Includes:
Two Strategist sessions per month
Trading process education
Strategy and risk-management sessions
Strategist recordings and templates
vs
Inner Circle
Includes:
Technical Blueprint
Strategist
Recordings from both pathways
Templates and worksheets
A more complete monthly learning structure
Direct contact with the Coaches
Your Roadmap to Building a Structured Trading Process
Our comprehensive framework is designed to empower you with a structured approach that simplifies complex choices, ensuring you make informed decisions with confidence.
With expert guidance and a supportive community, you’ll navigate challenges more effectively and achieve your goals faster.
Our unique, structured approach combines practical tools with personalized guidance, ensuring you not only learn but also apply your knowledge effectively in real-time trading scenarios.
Educational content only. Trading involves risk. Secure payment via Payfast.
Program Overview
Strategist
Before you can grow, you need to diagnose. In this kickoff session, we walk through a live trading audit designed to uncover what’s really holding you back from consistent performance. Using a structured 5-part framework, you’ll evaluate:
- Win rate & expectancy – Are your trades mathematically sound?
- Strategy types used – Are your methods aligned with your market?
- Execution consistency – Are you following your rules or freelancing?
- Capital deployment – Are you risking too much, or not enough?
- Time commitment vs returns – Is your effort aligned with your results?
You’ll receive a Trading Audit Template to complete privately after the session. This forms the foundation for your personalized growth path and feeds directly into the next session’s 90-day execution plan.
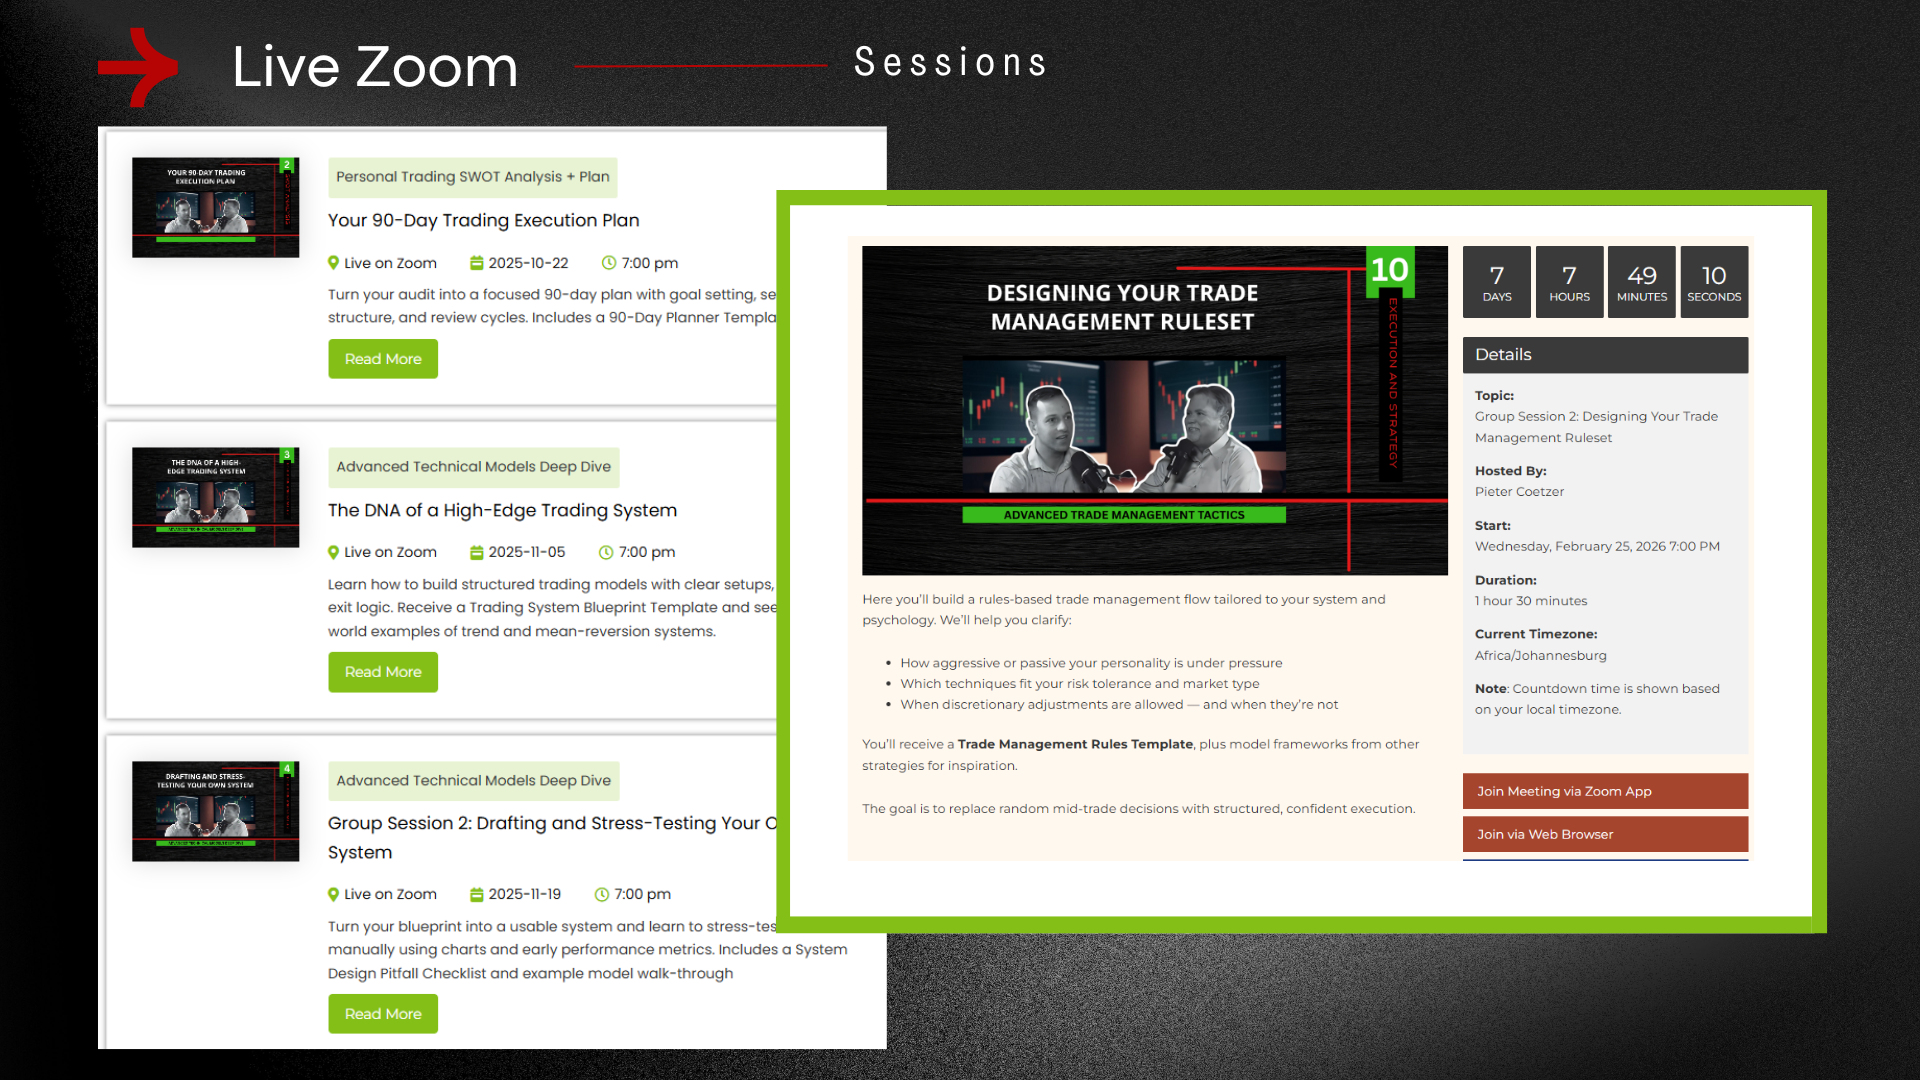
Now that you’ve identified your key trading bottlenecks, it’s time to build a focused and realistic action plan. In this session, you’ll learn how to design a 90-day trading execution plan that turns your audit results into measurable progress.
Turn your audit into a focused 90-day plan with goal setting, session structure, and review cycles. Includes a 90-Day Planner Template.
We’ll cover:
- Goal setting – Define what success looks like
- Session planning – Structure your daily and weekly trading time
- System review cycles – Set checkpoints for improvement and feedback
You’ll receive a 90-Day Planner Template, along with sample plans to help you get started. One or two volunteers may choose to share their plan for group feedback — completely optional.
In this session, we take a deep dive into how professional traders build advanced technical models that go beyond basic indicators. The goal is to understand what separates a generic setup from a structured, rules-based model with a real edge. Learn how to build structured trading models with clear setups, filters, and exit logic.
You’ll learn the 5 key components that form the backbone of any effective system:
- Market condition filter – Identify the environment your model works in
- Setup trigger – Define precise entry signals
- Confirmation logic – Add filters to reduce noise and false signals
- Entry method – Detail the exact conditions for pulling the trigger
- Exit rules – Create logical stop loss and take profit criteria
We’ll walk through examples of both trend-following and mean-reversion systems to show how these concepts apply in real markets.
You’ll also receive a Trading System Blueprint Template to start drafting your own model.
With your blueprint in hand, we now focus on transforming theory into practice. In this session, you’ll begin designing your own advanced model and stress-test it for logical consistency and clarity.
We’ll cover:
- Translating setups into rule-based logic.
- Manual chart testing to identify edge.
- Key metrics to evaluate system potential (e.g., win rate, reward-to-risk).
- Spotting design flaws before risking real money.
You’ll receive a System Design Pitfall Checklist and see a live example of a technical model being built and stress-tested from scratch.
Sharing your draft system for feedback is optional — the focus is on creating a structure that matches your style, market, and mindset. This is where trading becomes systematic, not just reactive.
Most traders blow up not from bad trades — but from bad risk math. In this session, we break down the concept of risk of ruin and why it’s the #1 silent killer of trading accounts.
You’ll learn:
- The formula for calculating your personal risk of ruin
- Why win rate and payoff ratio are not enough
- How drawdown, capital at risk, and system edge interact
- The truth about why under-capitalised accounts struggle the most
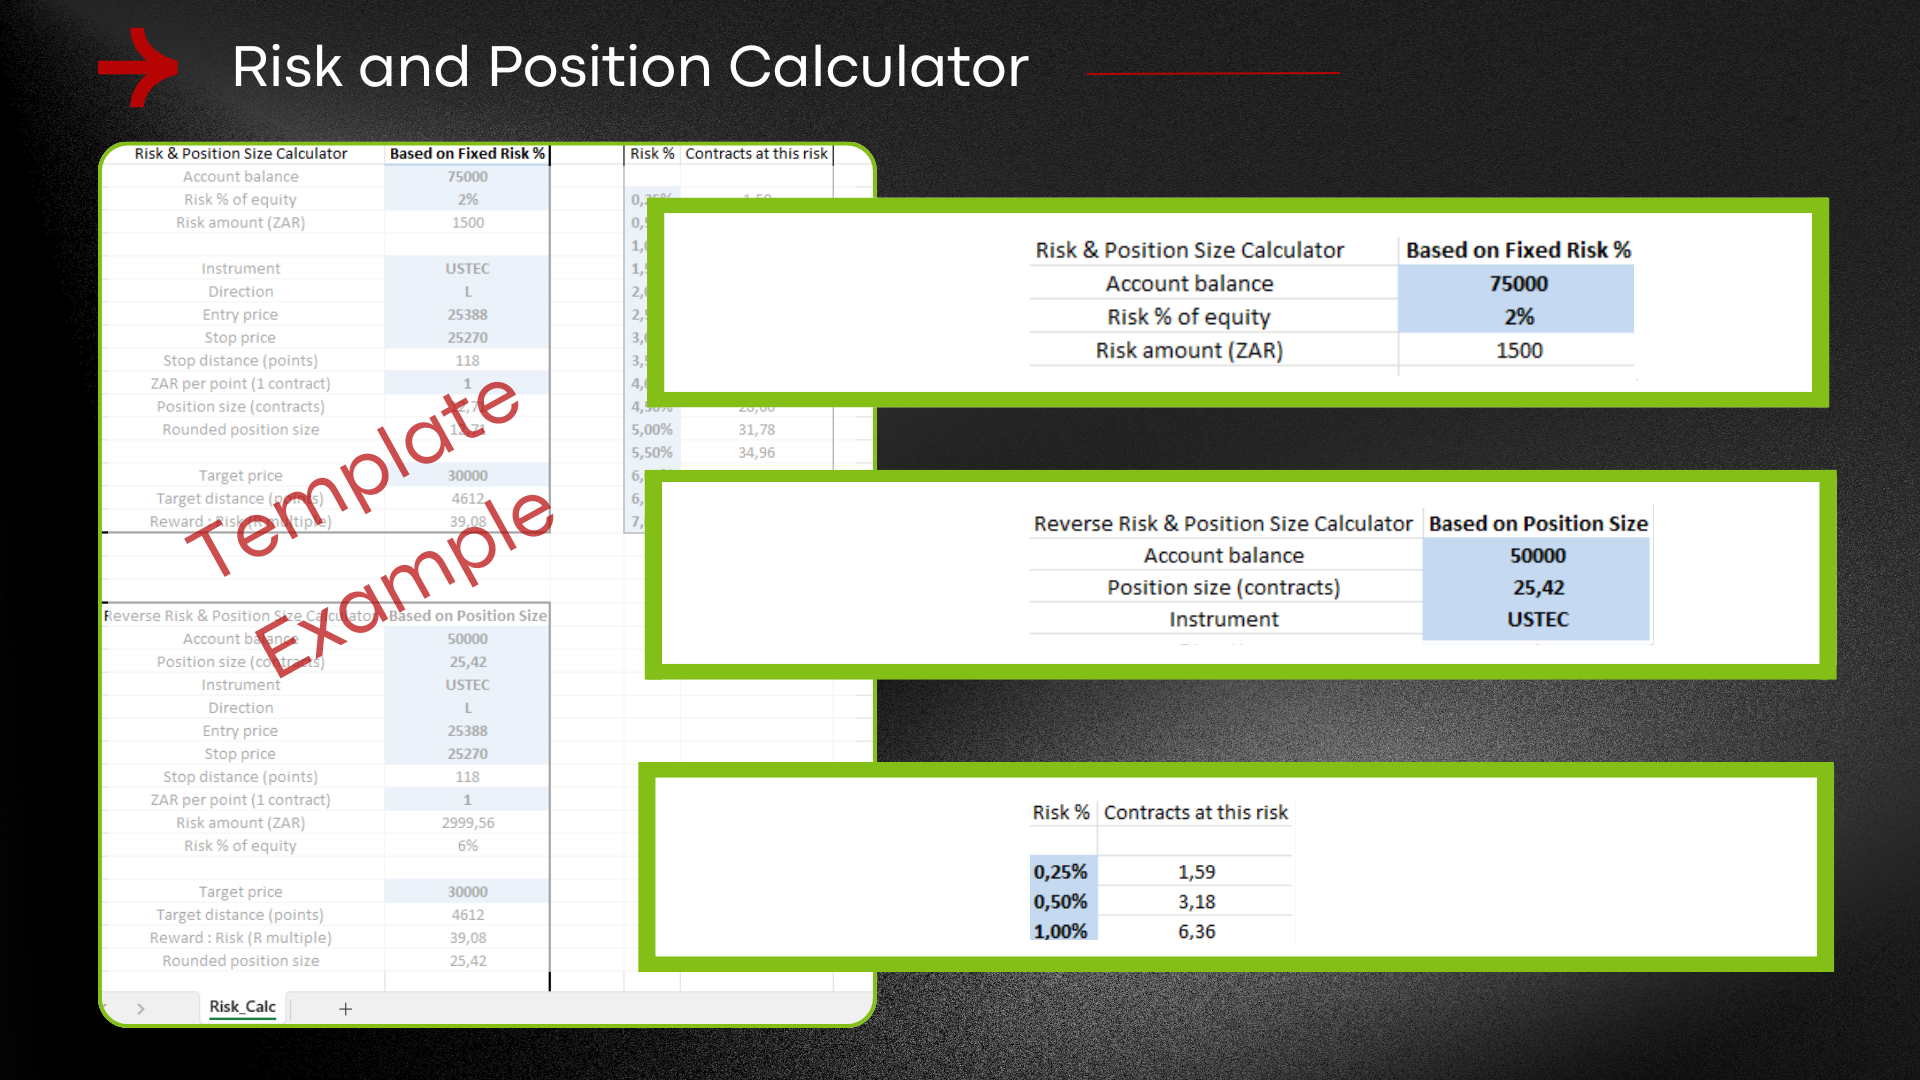
You’ll receive a Risk of Ruin Calculator (Google Sheets) to plug in your stats and see your personal probability of long-term survival or collapse.
Once you understand your risk tolerance and system volatility, it’s time to scale — safely. This session focuses on crafting a risk plan that protects your capital while giving you room to grow.
We’ll cover:
- Creating dynamic position sizing models
- Fixed fractional vs volatility-adjusted risk
- Scaling in/out of trades based on equity growth
- Risk limits: max daily, weekly, and monthly loss rules
You’ll receive a Risk Scaling Template to define your personal rules based on your current account size, strategy, and goals.
This is about becoming a risk manager first — so your trading account survives long enough to thrive.
Even with the best strategy, your mind can sabotage your execution. In this session, we unpack the core emotional and cognitive patterns that lead to inconsistency, hesitation, and tilt.
You’ll explore:
- Fear of loss and the over-avoidance loop
- Revenge trading and frustration cycles
- Overconfidence after wins
- Paralysis from perfectionism or past trauma
You’ll receive a Mental Game Self-Assessment to help identify your dominant pattern and where it most affects your trading behavior.
With awareness comes action. This session helps you build a repeatable psychological routine to stay grounded, focused, and emotionally resilient.
We’ll cover:
- Pre-market routines and mental reset triggers
- Tools like breathwork, affirmations, and journaling
- Post-trade recovery and emotional debrief techniques
- Customizing a “mental fitness checklist” for daily use
You’ll receive a Mental Edge Routine Template and examples of real trader mindset workflows used by top performers.
This is about managing the person behind the system — so your edge shows up when it matters.
Here you’ll build a rules-based trade management flow tailored to your system and psychology. We’ll help you clarify:
- How aggressive or passive your personality is under pressure
- Which techniques fit your risk tolerance and market type
- When discretionary adjustments are allowed — and when they’re not
You’ll receive a Trade Management Rules Template, plus model frameworks from other strategies for inspiration.
The goal is to replace random mid-trade decisions with structured, confident execution.
Different market conditions demand different responses. In this session, you’ll learn how to categorize markets (e.g., trend, range, chop, volatility spike) and map out your tactical responses to each.
We’ll cover:
- How to quickly identify the current environment
- What to do in each: entries, exits, risk
- Examples of playbooks for trend and range systems
- When to sit out vs when to double down
You’ll receive a Market Playbook Template to start capturing your best approaches per condition.
This hands-on session is about building evidence-based playbooks using your own trades and screenshots.
We’ll walk through:
- Collecting examples of successful setups by condition
- What to include: chart image, entry logic, management, outcome
- Creating a digital or printed binder of setups to reference before sessions
You’ll receive a Screenshot Cataloging Guide and an example of a complete mini playbook.
This builds confidence by replacing market guesswork with scenario-based readiness.
Most traders either don’t journal or do it wrong. In this session, we explore how to build a journaling system that’s fast, insightful, and actually improves performance.
We’ll cover:
- What to track (hint: it’s not just win/loss)
- The 3 layers of journaling: data, emotion, and reflection
- Examples of effective trade log formats (manual and digital)
- How to reduce journaling to under 5 minutes per day
You’ll receive a Journaling Template Pack — options for Google Sheets, Notion, and handwritten styles.
Journaling only works if you close the loop. This session focuses on how to extract insights from your log and turn them into weekly or monthly improvements.
You’ll learn:
- Reviewing for patterns in wins and losses
- Tracking strategy drift and rule-breaking
- Creating review rituals (Friday reviews, monthly feedback loops)
- Using tags and notes to filter by setup, time, or emotion
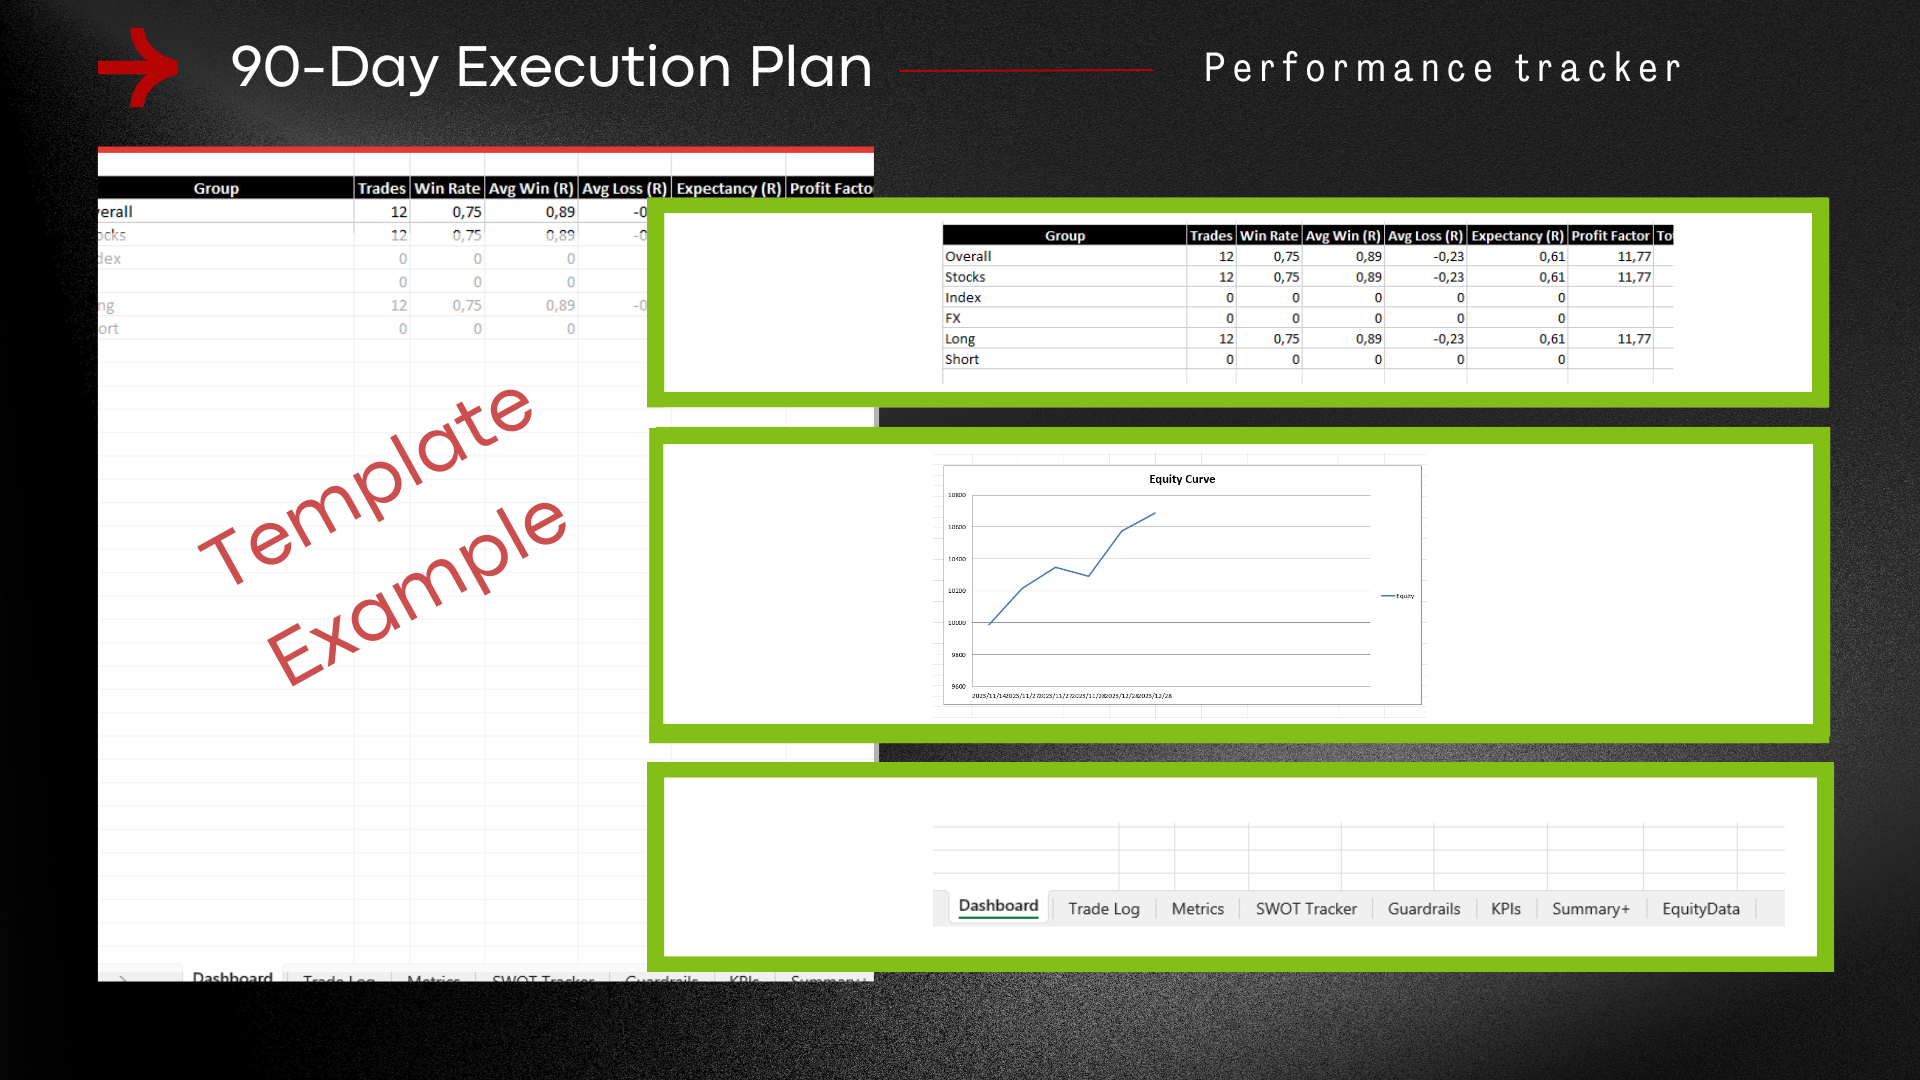
You’ll receive a Journaling Review Cheat Sheet and a Tracker Dashboard Template to monitor consistency over time.
This creates a feedback system that turns experience into actual growth.
No system works in all conditions. In this session, we break down how trend and range markets behave — and how to build strategies designed for each.
You’ll explore:
- How to detect market mode with EMAs, ATR, and price action
- Setup structures that work best in each condition
- Managing entries and exits based on volatility cycles
- When to switch modes — and when to stay out entirely
You’ll receive a Trend/Range Strategy Comparison Guide and a decision tree for identifying current conditions.
Now you’ll take what you’ve learned and refine your system(s) to work better within your preferred market mode.
We’ll cover:
- Adjusting entry filters and exit logic per condition
- Using optional overrides (e.g., range filters in trending systems)
- Creating mode-based trade plans to switch between systems
You’ll receive a Strategy Adjustment Template and access to two sample systems — one trend, one range — to compare and adapt.
This teaches versatility while maintaining structure — essential for long-term edge
Group Session 1: expanding your trading universe
Most traders over-concentrate — in strategy or market. In this session, we explore how to intelligently diversify across instruments without losing focus.
You’ll learn:
- What diversification actually means in trading (not just asset class)
- How to evaluate which instruments fit your edge
- The pros and cons of Forex, Indices, Share CFDs, and Commodities
- How to filter a watchlist to 3–6 high-fit instruments
You’ll receive a Market Evaluation Checklist to assess what’s tradable for you.
Diversification should amplify your edge, not scatter it. This session helps you create a manageable, focused list of symbols that suit your style.
We’ll cover:
- Creating core and secondary instrument tiers
- Matching systems to market personality (e.g., trending vs volatile)
- Building your daily review plan for multiple instruments
You’ll receive a Multi-Instrument Tracker Sheet and a template for structured market prep across your list.
This keeps your attention sharp while giving you more opportunity flow.
Scaling is more than increasing size — it’s about upgrading your process. In this session, you’ll learn what it means to operate like a professional with larger capital.
We’ll cover:
- The difference between scaling systems vs scaling size
- Risk compression and compounding models
- Managing emotions as trade size increases
- When to adjust systems for capital tiers (R10k vs R100k vs R1m+)
You’ll receive a Scaling Strategy Map to plan your next capital level with structure.
This session helps you map out how to responsibly grow capital while protecting edge and psychology.
We’ll cover:
- Milestone-based capital increases
- Withdrawals vs reinvestment strategies
- How to split capital across systems/instruments
- Adding passive capital sources (funded accounts, prop firms, etc.)
You’ll receive a Capital Growth Planner to help visualise your future scaling path.
This sets the mindset and structure to move from small trader to capital allocator.
Burnout in trading isn’t just fatigue — it’s a slow erosion of focus, confidence, and motivation. In this session, we explore the root causes of burnout and how it shows up in your trading patterns.
We’ll cover:
- The difference between stress, fatigue, and true burnout
- Key warning signs: overtrading, detachment, emotional numbness
- How system mismatch, poor routines, and external stress amplify the problem
- Why more screen time or “pushing through” often makes it worse
You’ll receive a Burnout Risk Checklist to assess your current state and pinpoint the key areas causing overload or disengagement.
This session focuses on practical recovery strategies and long-term sustainability — without stepping away from trading completely.
We’ll explore:
- Energy-based trade scheduling (not just time-based)
- Daily and weekly rhythm design for focus and rest
- Using “non-trading” days productively
- Realigning strategy with lifestyle and personality
You’ll receive a Sustainable Trading Planner to design a rhythm that works for you — not against you. This is about staying in the game with energy, clarity, and longevity.
In this powerful end-of-year session, we reflect on what the last 12 months revealed — in performance, systems, psychology, and growth.
We’ll guide you through:
- Reviewing trade logs and journal entries for key patterns
- Identifying what worked, what didn’t, and what surprised you
- Filtering your most profitable setups and conditions
- Reviewing equity curves, risk stats, and decision consistency
You’ll receive an Annual Review Worksheet and a Metrics Summary Template to capture your top-level insights.
With your insights gathered, it’s time to set direction. This session helps you create a forward-looking game plan with clear intentions, goals, and system alignment.
We’ll cover:
- Setting realistic, data-driven goals (not vague resolutions)
- Choosing 1–2 core systems to refine or scale
- Building a quarterly checkpoint rhythm
- Creating your next launch checklist
You’ll receive a 12-Month Relaunch Planner with space for goals, habits, and checkpoints — so you enter the new year with clarity and momentum.
Technical Blueprint
Learn how to identify higher highs, higher lows, lower highs, and lower lows so trend direction becomes clearer and more consistent across different charts and markets.
Objectives
- Identify higher highs, higher lows, lower highs, and lower lows
- Read trend direction through structure rather than guesswork
- Separate cleaner structure from noisy price movement
- Understand how pullbacks fit inside trend development
- Build a stronger foundation for reading market structure
Learn how to identify meaningful support and resistance zones using swing points, reaction areas, and price structure.
Objectives
- Understand the purpose of support and resistance in chart reading
- Use swing points and reaction areas to mark levels
- Create practical zones instead of cluttering charts with lines
- Recognise major turning points versus minor reactions
- Improve chart clarity through cleaner level selection
Build on session 1 by learning when to use candle wicks, when to use bodies, and how to judge whether price is reacting cleanly at an important level.
Objectives
- Know when candle wicks matter more than bodies
- Judge whether price is respecting a level cleanly
- Separate cleaner zones from messy or weak zones
- Recognise when a level has lost relevance
- Use level quality as part of a broader technical view
Learn how moving averages can be used to read trend condition, pullback quality, and chart structure more effectively.
Objectives
- Understand what the 8, 21, and 89 EMA can show on a chart
- Use EMAs to judge basic trend condition
- Recognise pullbacks into dynamic support or resistance areas
- Improve chart reading by combining EMAs with price structure
- Avoid relying on moving averages in isolation
Take the next step by looking at how EMA behaviour changes during pullbacks, transitions, and possible trend reversals.
Objectives
- Read price position relative to the 8 and 21 EMAs
- Understand how EMA crosses fit into trend context
- Recognise when EMA behaviour suggests weakening momentum
- Use the 21 and 89 EMA relationship in a broader trend view
- Avoid taking EMA crosses without structure confirmation
Learn how candles can reveal momentum, hesitation, compression, and possible breakout or reversal conditions.
Objectives
- Understand the practical meaning of candle bodies and wicks
- Recognise rejection, expansion, and indecision behaviour
- Use candles to read buying and selling pressure
- Identify compression as a build-up condition
- Treat candles as context rather than isolated signals
Build on candle reading by showing why the same pattern can be strong in one location and weak in another.
Objectives
- Compare candle patterns at meaningful versus poor locations
- Combine candles with structure and support or resistance
- Recognise when a pattern is strong because context supports it
- Avoid trading candle patterns in the middle of noise
- Improve timing by using candle behaviour more selectively
Learn how Fibonacci retracement levels can help identify pullback zones within a broader technical analysis process.
Objectives
- Understand the purpose of Fibonacci retracement levels
- Apply Fibonacci to cleaner swings and structure
- Use retracement areas as zones of interest rather than guarantees
- Combine Fibonacci with support, resistance, and trend
- Avoid forcing Fibonacci onto poor chart swings
Expand on retracements by using extensions to judge overextended price, reaction zones, and possible continuation targets.
Objectives
- Use Fibonacci extensions to identify stretched price conditions
- Recognise possible reaction and exhaustion areas
- Use extensions alongside structure and momentum context
- Judge whether price still has room to continue
- Build a more practical Fibonacci workflow
Learn how to judge whether a pattern is technically strong by looking at location, structure, timing, and room to move.
Objectives
- Separate a chart pattern from a technically valid setup
- Judge setup location in relation to structure and levels
- Assess whether timing is early, mature, or already late
- Recognise when a setup has enough room to work
- Improve technical selectivity by focusing on setup quality
Take setup quality further by learning how to filter out poor chart conditions and improve technical selectivity.
Objectives
- Understand what confirmation and confluence actually add
- Combine structure, trend, candles, and context more effectively
- Filter out weak signals and low-quality chart conditions
- Avoid overcomplicating analysis with unnecessary factors
- Build a cleaner process for identifying stronger setups
Focus on patterns that still have practical value, such as flags, wedges, triangles, channels, and double tops or bottoms.
Objectives
- Recognise common chart patterns that still add value
- Understand the structure behind flags, wedges, and triangles
- Read patterns as behaviour rather than textbook shapes
- Compare cleaner patterns with weaker or distorted ones
- Use patterns to support chart reading without forcing them
Build on pattern recognition by learning how context, maturity, and location affect pattern quality.
Objectives
- Judge whether a pattern is early, mature, or already late
- Use context and location to assess pattern quality
- Recognise when a pattern is weak despite looking neat
- Avoid textbook pattern trading without market context
- Improve trade selection by grading pattern quality
Learn how to judge breakout quality using compression, location, momentum, and available room.
Objectives
- Understand what a breakout is actually showing on a chart
- Recognise cleaner breakout structures and build-up conditions
- Judge whether a breakout has enough room to develop
- Use momentum and location to improve breakout assessment
- Avoid reacting to every move through a level
Study how weak breaks fail, how trap structures form, and why failed breakouts often create stronger technical opportunities.
Objectives
- Recognise failed breakouts and false continuation
- Understand how trap structures usually develop
- Use failed moves as information rather than frustration
- Separate cleaner reversal opportunity from random noise
- Improve decision-making around breakout failure
Learn when stretched markets are more likely to revert and when fading price is a low-quality idea.
Objectives
- Understand what mean reversion is in practical chart terms
- Recognise stretched price versus healthy trend movement
- Separate cleaner reversion conditions from dangerous fades
- Use location and context to improve reversion analysis
- Avoid treating every extended move as an automatic reversal
Apply oscillators properly by using them to read stretch, exhaustion, and market condition in context.
Objectives
- Understand what Stochastic, CCI, and Williams %R are measuring
- Use oscillators to support chart context rather than replace it
- Recognise stretch and exhaustion more effectively
- Separate trend continuation conditions from reversion conditions
- Avoid simplistic oscillator signals without technical context
Learn how RSI can be used to read momentum condition, shift, and possible weakness rather than as a simplistic signal tool.
Objectives
- Understand RSI beyond basic overbought and oversold ideas
- Use RSI to judge momentum condition and possible shift
- Recognise when RSI behaves differently in trends and ranges
- Combine RSI with price action and structure
- Avoid reducing RSI to one-click trading signals
Build on momentum analysis by using Bollinger Bands to identify stretch, squeezes, and volatility expansion conditions.
Objectives
- Use Bollinger Bands to recognise compression and expansion
- Identify stretch and squeeze conditions more clearly
- Understand how volatility affects setup quality
- Combine volatility clues with structure and momentum context
- Improve timing by reading volatility behaviour more practically
Learn how to compare markets, sectors, or shares to identify technical leadership and laggards.
Objectives
- Understand what relative strength and weakness mean on charts
- Compare markets, sectors, or shares more effectively
- Recognise leadership and laggards in a technical way
- Use comparison work to improve chart selection
- Add a market-selection layer to technical analysis
Turn relative strength work into a practical process for finding charts with stronger technical potential.
Objectives
- Build a cleaner technical watchlist process
- Use chart quality and leadership clues for selection
- Filter weaker opportunities out earlier
- Focus attention on charts with stronger technical potential
- Improve preparation by narrowing attention more effectively
Learn how the opening phase of a market session can shape chart quality, false starts, and early technical opportunity.
Objectives
- Understand why opening range behaviour matters
- Recognise early momentum versus false starts
- Use session structure to improve chart context
- Separate cleaner early opportunity from opening noise
- Add time-of-day awareness to technical analysis
Here's What You Get with your Inner Circle Membership Every Month
A broader learning structure designed to support long-term trader development.
It is suitable for traders who want the full learning environment, including technical analysis development, broader trading education, ongoing resources,
and the ability to ask questions directly when they need help or clarity.
It is also suited to members who want to follow the full Traders Mastermind
pathway instead of joining only one part of the programme.
- Full access to the Technical Blueprint pathway.
- One beginner-focused technical analysis session.
- One intermediate technical analysis session.
- Access to selected recordings and resources included in the Inner Circle membership.
- Full access to the Strategist programme.
- Two Strategist sessions focused on trading process, planning, risk, systems, market behaviour, and structured decision-making.
- Direct one-on-one contact for questions and guidance.
Educational content only. Trading involves risk. Secure payment via Payfast.
Your Trading Coaches

Pieter’s trading journey began in 2016 while studying for his BCom in Business Management, where a live trading group and automated systems sparked his passion for the markets.
By 2018, he was trading full-time — focusing on long-term trends and international equities. His approach is built on patience, strategic positioning, and the power of compounding returns.
At Traders Mastermind, Pieter shares these principles through targeted sessions, helping members apply proven strategies with confidence in real market conditions.

With over 20 years in the markets, Warren has traded it all — from stocks and indices to forex.
He’s trained hundreds of traders, served as Head Market Analyst for IG Markets, and shared his insights on CNBC Africa and leading radio stations.
From 2015 to 2024, Warren coached clients at Standard Bank Securities, running technical analysis webinars and workshops, while also contributing to ABSA Bank’s educational programs.
Today, he’s laser-focused on one thing: helping traders master the markets with proven strategies and clear, actionable training.
They fail because they’re operating without structure, feedback, or weekly accountability.
What’s the one thing you wish someone had taught you earlier in your trading journey?
Member Reviews
See what our members have to say and share your experience. Help others make informed decisions.
Verified Feedback
Real-World Insights
Your Voice Matters
Build your system.
Trade it with discipline.
You need one process, applied consistently.
The Technical Blueprint takes members through a step-by-step development process. is.
Each month includes one beginner session and one intermediate session, allowing members to first understand the core concept and then learn how that same concept applies to real chart analysis.
Your Technical Blueprint Membership Includes:
Each Session includes:
One beginner-focused technical analysis session.
One intermediate technical analysis session.
A structured monthly topic that builds on the previous month.
Practical chart examples showing clean versus poor-quality setups.
A clear progression from basic chart reading to more advanced decision-making.
Access to the relevant recordings and resources included in the chosen membership tier.
Educational content only. Trading involves risk. Secure payment via Payfast.