
Structured Trading Coaching
The Traders Mastermind Technical Blueprint
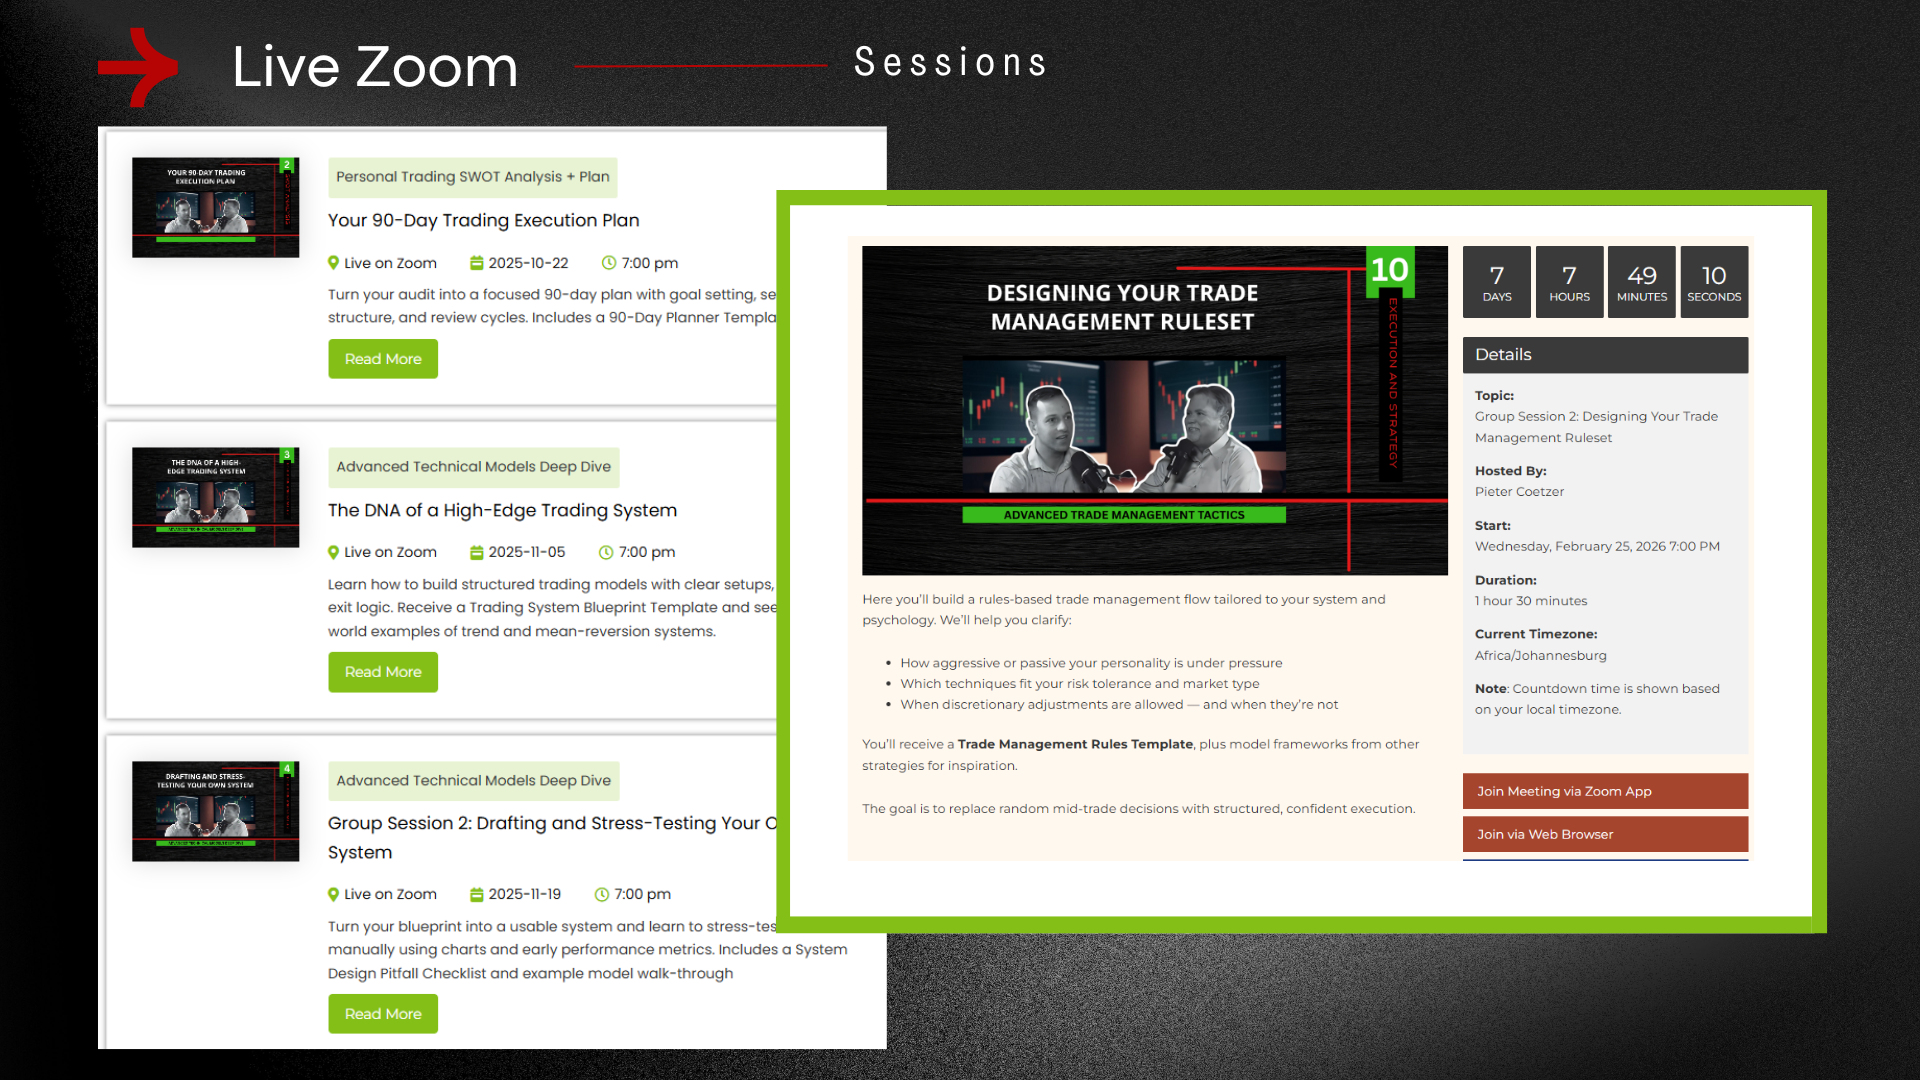
The Traders Mastermind Technical Blueprint is a structured technical analysis pathway designed to help traders build a clearer, more organised way of reading charts.
Instead of jumping from one random chart pattern to the next, the Technical Blueprint takes members through a step-by-step development process. Each month includes one beginner session and one intermediate session, allowing members to first understand the core concept and then learn how that same concept applies to real chart analysis.
The focus is on practical chart reading, market structure, trend behaviour, support and resistance, pullbacks, breakouts, reversals, candlestick interpretation, Fibonacci zones, moving averages, confluence, and building a repeatable technical analysis routine.
Who Is This For?
This pathway is designed for traders who want to improve their technical analysis without becoming overwhelmed by complicated terminology or conflicting methods.
It is suitable for newer traders who need a proper foundation, as well as developing traders who already understand basic charting but want a clearer process for reading price action and improving trade selection.
What members get each month
- One beginner-focused technical analysis session.
- One intermediate technical analysis session.
- A structured monthly topic that builds on the previous month.
- Practical chart examples showing clean versus poor-quality setups.
- A clear progression from basic chart reading to more advanced decision-making.
- Access to the relevant recordings and resources included in the Technical Blueprint membership level.
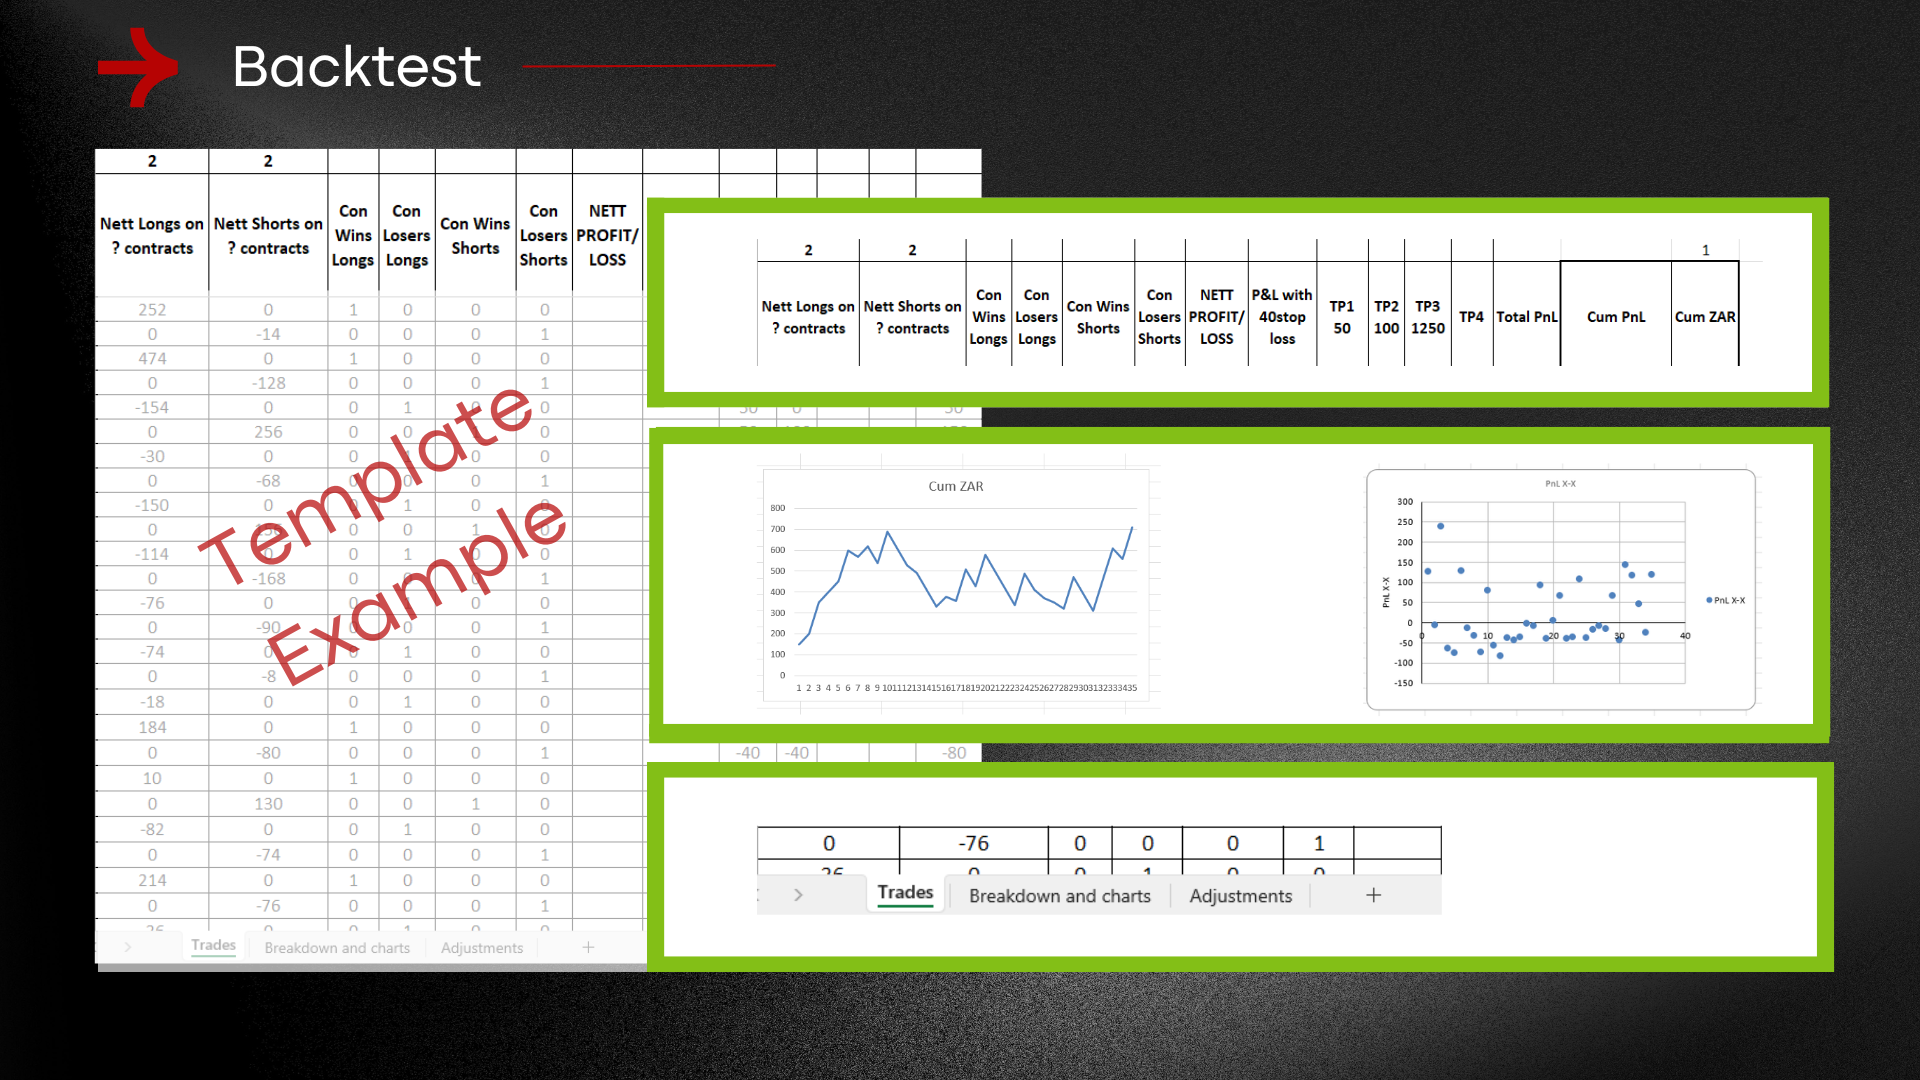
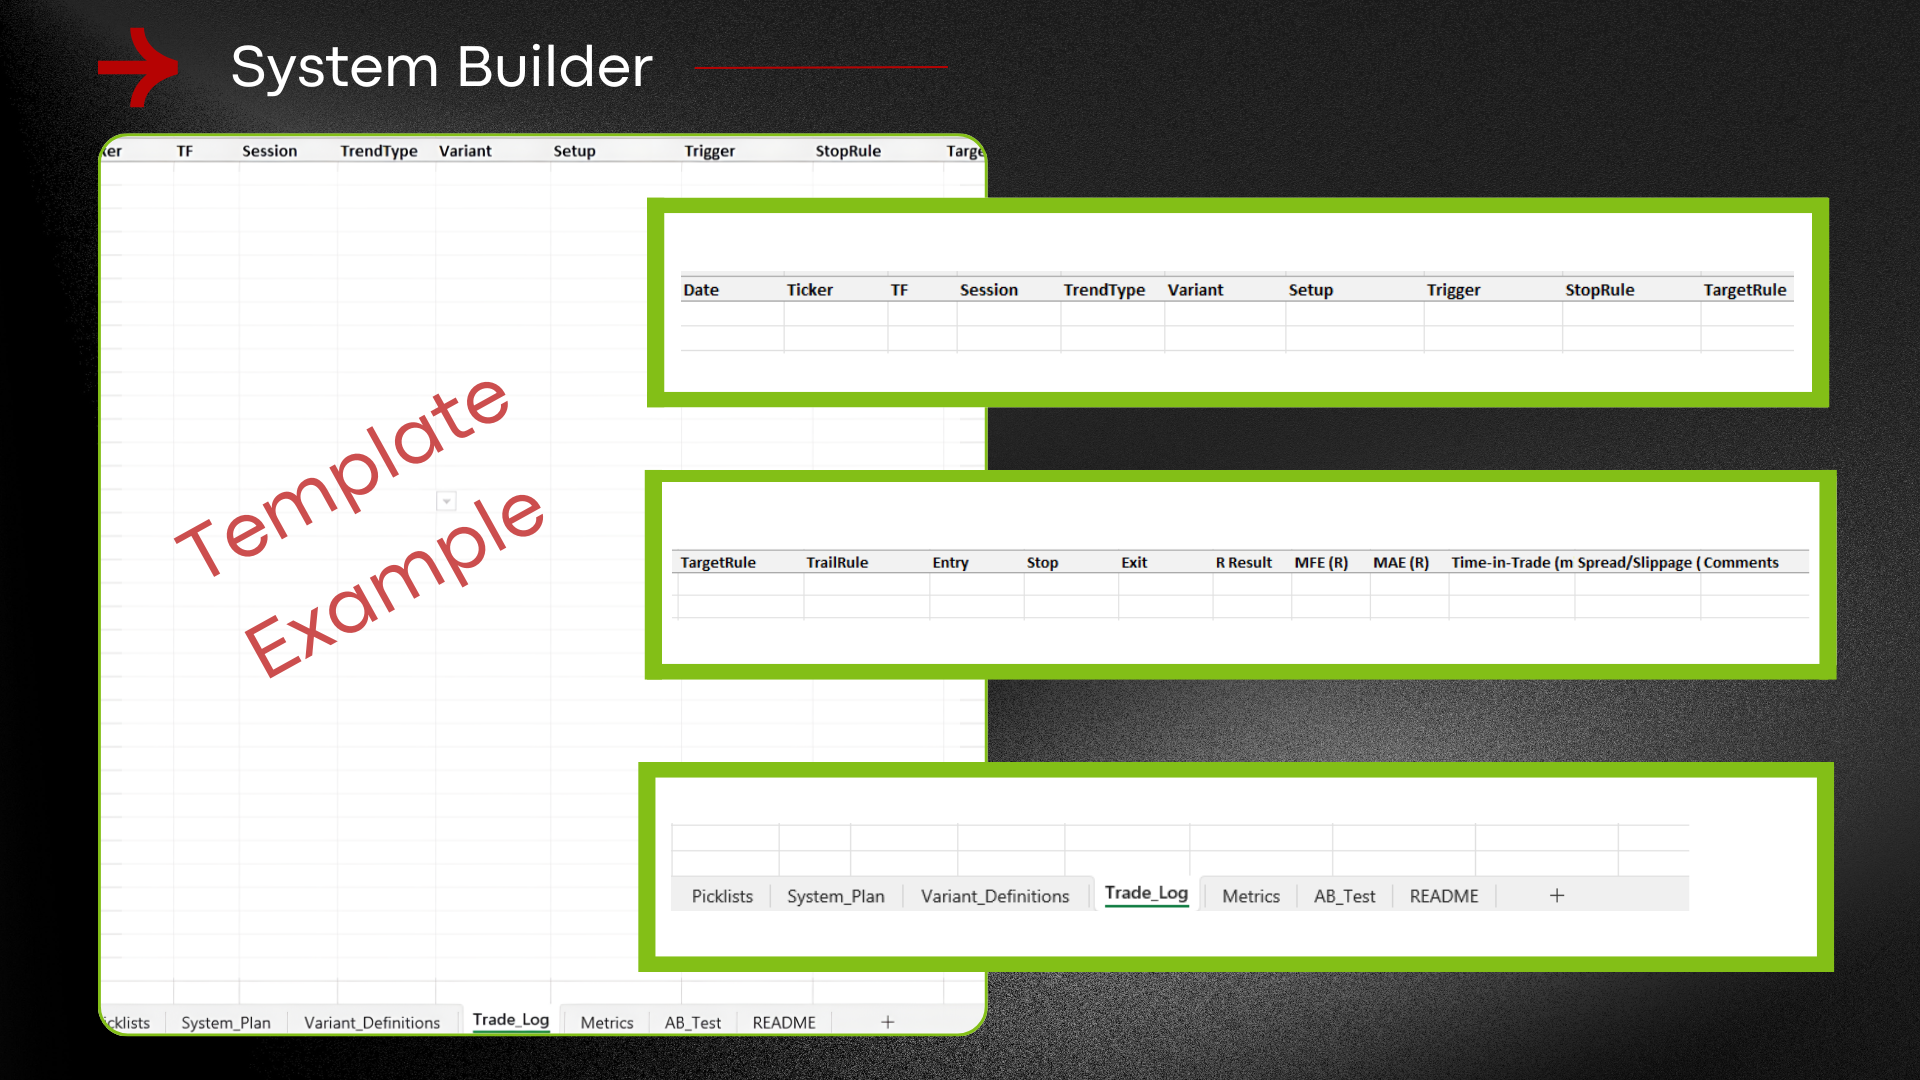
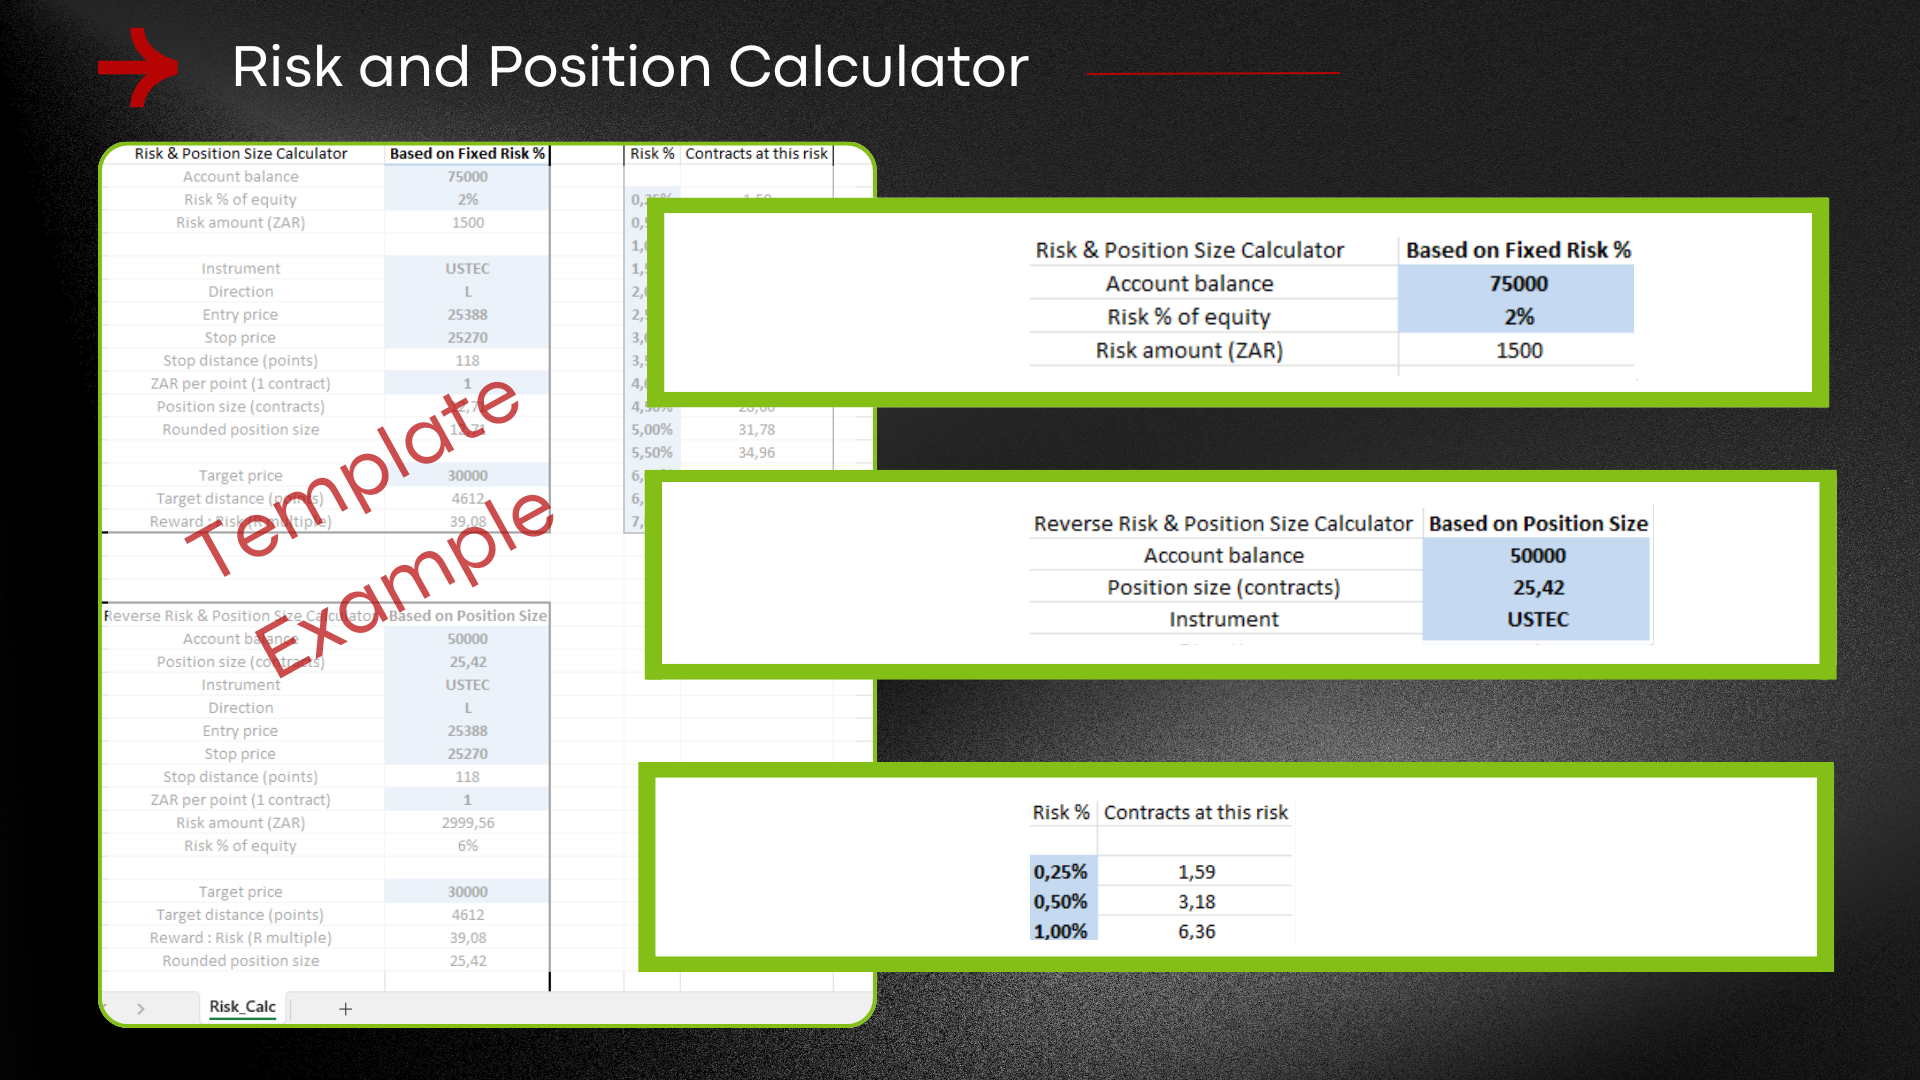
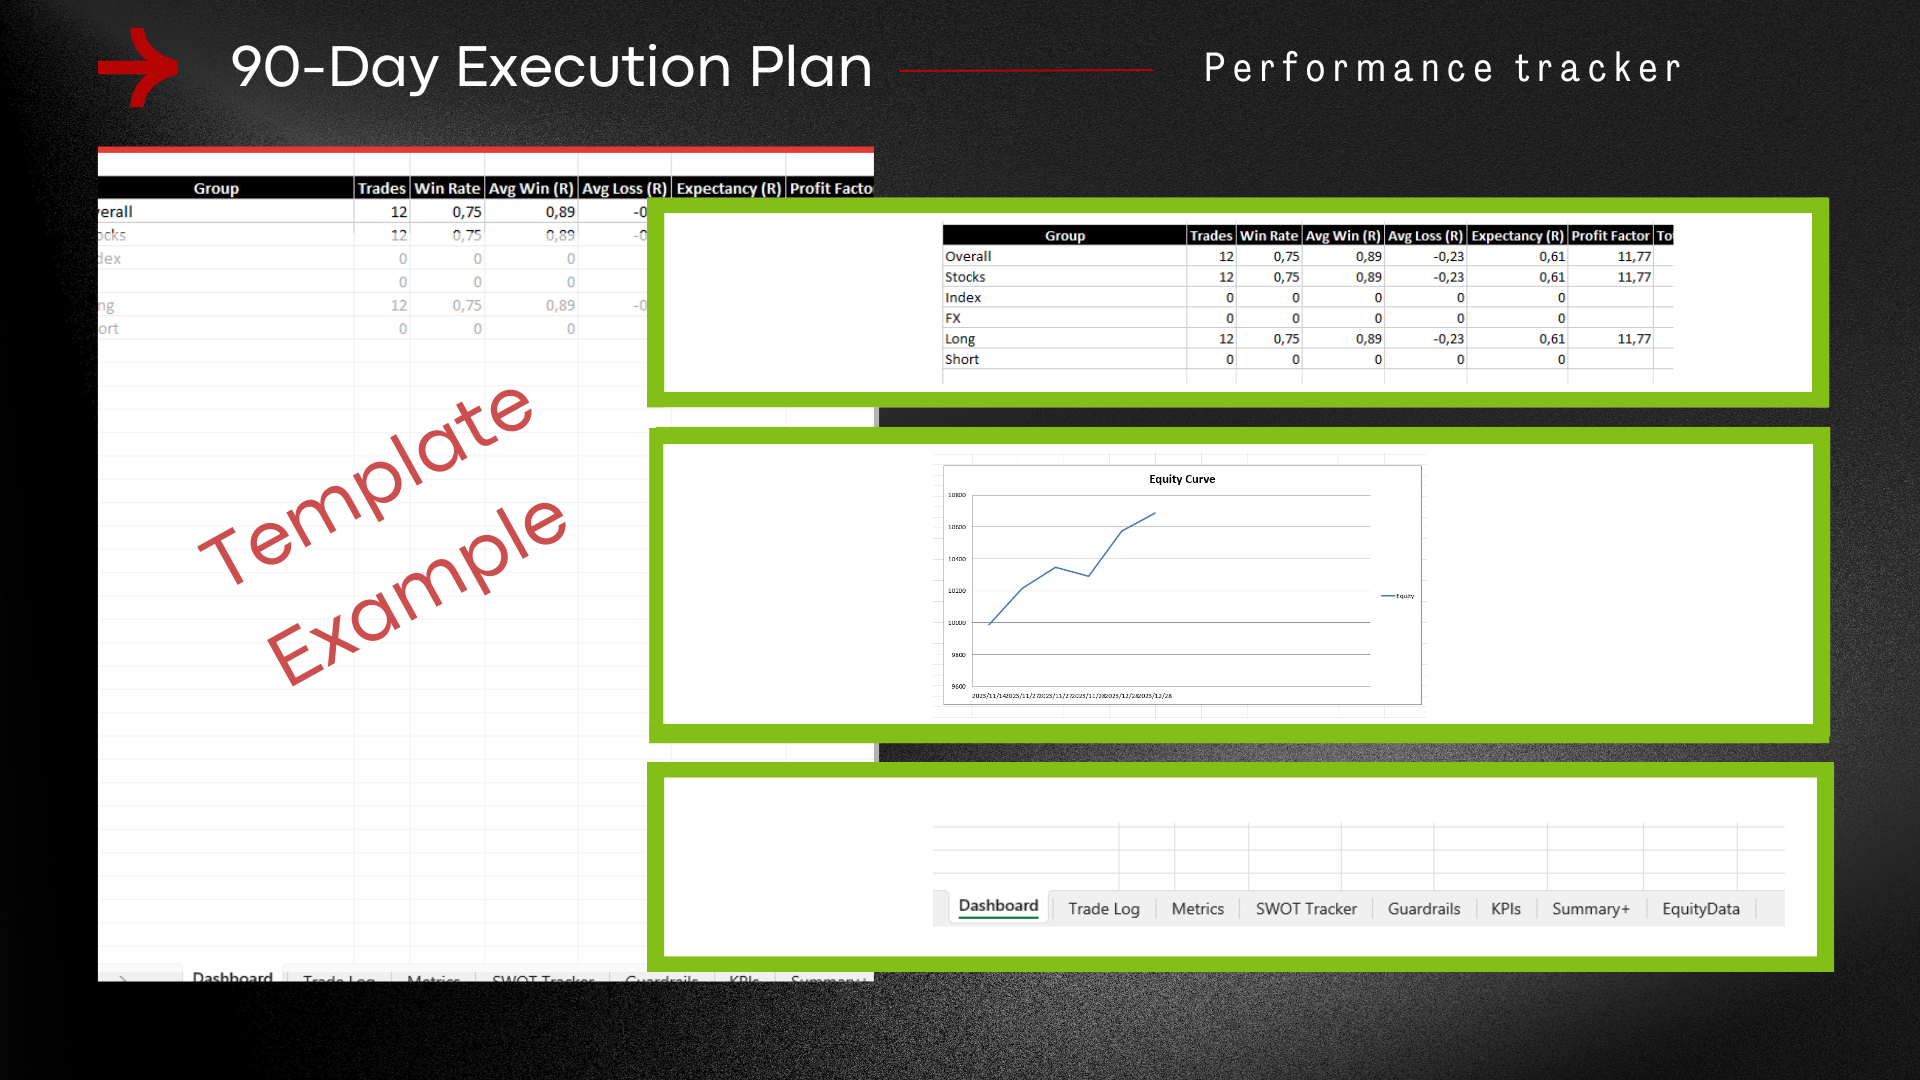
The Traders Mastermind Templates
The learning approach
The Technical Blueprint is built around progression. Each beginner session teaches the foundation of a topic. Each intermediate session then applies that same topic to chart quality, decision-making, and real-world market behaviour.
The aim is not to overload members with dozens of indicators or isolated signals. The aim is to help them build a clear, repeatable technical process that improves how they read charts, filter poor conditions, and understand market behaviour.
Important note
The Traders Mastermind Technical Blueprint is educational in nature. It is designed to teach technical analysis concepts, chart-reading skills, and structured thinking. It does not guarantee trading results and should not be treated as personalised financial advice.
Program Overview
Learn how to identify higher highs, higher lows, lower highs, and lower lows so trend direction becomes clearer and more consistent across different charts and markets.
Objectives
- Identify higher highs, higher lows, lower highs, and lower lows
- Read trend direction through structure rather than guesswork
- Separate cleaner structure from noisy price movement
- Understand how pullbacks fit inside trend development
- Build a stronger foundation for reading market structure
Learn how to identify meaningful support and resistance zones using swing points, reaction areas, and price structure.
Objectives
- Understand the purpose of support and resistance in chart reading
- Use swing points and reaction areas to mark levels
- Create practical zones instead of cluttering charts with lines
- Recognise major turning points versus minor reactions
- Improve chart clarity through cleaner level selection
Build on session 1 by learning when to use candle wicks, when to use bodies, and how to judge whether price is reacting cleanly at an important level.
Objectives
- Know when candle wicks matter more than bodies
- Judge whether price is respecting a level cleanly
- Separate cleaner zones from messy or weak zones
- Recognise when a level has lost relevance
- Use level quality as part of a broader technical view
Learn how moving averages can be used to read trend condition, pullback quality, and chart structure more effectively.
Objectives
- Understand what the 8, 21, and 89 EMA can show on a chart
- Use EMAs to judge basic trend condition
- Recognise pullbacks into dynamic support or resistance areas
- Improve chart reading by combining EMAs with price structure
- Avoid relying on moving averages in isolation
Take the next step by looking at how EMA behaviour changes during pullbacks, transitions, and possible trend reversals.
Objectives
- Read price position relative to the 8 and 21 EMAs
- Understand how EMA crosses fit into trend context
- Recognise when EMA behaviour suggests weakening momentum
- Use the 21 and 89 EMA relationship in a broader trend view
- Avoid taking EMA crosses without structure confirmation
Learn how candles can reveal momentum, hesitation, compression, and possible breakout or reversal conditions.
Objectives
- Understand the practical meaning of candle bodies and wicks
- Recognise rejection, expansion, and indecision behaviour
- Use candles to read buying and selling pressure
- Identify compression as a build-up condition
- Treat candles as context rather than isolated signals
Build on candle reading by showing why the same pattern can be strong in one location and weak in another.
Objectives
- Compare candle patterns at meaningful versus poor locations
- Combine candles with structure and support or resistance
- Recognise when a pattern is strong because context supports it
- Avoid trading candle patterns in the middle of noise
- Improve timing by using candle behaviour more selectively
Learn how Fibonacci retracement levels can help identify pullback zones within a broader technical analysis process.
Objectives
- Understand the purpose of Fibonacci retracement levels
- Apply Fibonacci to cleaner swings and structure
- Use retracement areas as zones of interest rather than guarantees
- Combine Fibonacci with support, resistance, and trend
- Avoid forcing Fibonacci onto poor chart swings
Expand on retracements by using extensions to judge overextended price, reaction zones, and possible continuation targets.
Objectives
- Use Fibonacci extensions to identify stretched price conditions
- Recognise possible reaction and exhaustion areas
- Use extensions alongside structure and momentum context
- Judge whether price still has room to continue
- Build a more practical Fibonacci workflow
Learn how to judge whether a pattern is technically strong by looking at location, structure, timing, and room to move.
Objectives
- Separate a chart pattern from a technically valid setup
- Judge setup location in relation to structure and levels
- Assess whether timing is early, mature, or already late
- Recognise when a setup has enough room to work
- Improve technical selectivity by focusing on setup quality
Take setup quality further by learning how to filter out poor chart conditions and improve technical selectivity.
Objectives
- Understand what confirmation and confluence actually add
- Combine structure, trend, candles, and context more effectively
- Filter out weak signals and low-quality chart conditions
- Avoid overcomplicating analysis with unnecessary factors
- Build a cleaner process for identifying stronger setups
Focus on patterns that still have practical value, such as flags, wedges, triangles, channels, and double tops or bottoms.
Objectives
- Recognise common chart patterns that still add value
- Understand the structure behind flags, wedges, and triangles
- Read patterns as behaviour rather than textbook shapes
- Compare cleaner patterns with weaker or distorted ones
- Use patterns to support chart reading without forcing them
Build on pattern recognition by learning how context, maturity, and location affect pattern quality.
Objectives
- Judge whether a pattern is early, mature, or already late
- Use context and location to assess pattern quality
- Recognise when a pattern is weak despite looking neat
- Avoid textbook pattern trading without market context
- Improve trade selection by grading pattern quality
Learn how to judge breakout quality using compression, location, momentum, and available room.
Objectives
- Understand what a breakout is actually showing on a chart
- Recognise cleaner breakout structures and build-up conditions
- Judge whether a breakout has enough room to develop
- Use momentum and location to improve breakout assessment
- Avoid reacting to every move through a level
Study how weak breaks fail, how trap structures form, and why failed breakouts often create stronger technical opportunities.
Objectives
- Recognise failed breakouts and false continuation
- Understand how trap structures usually develop
- Use failed moves as information rather than frustration
- Separate cleaner reversal opportunity from random noise
- Improve decision-making around breakout failure
Learn when stretched markets are more likely to revert and when fading price is a low-quality idea.
Objectives
- Understand what mean reversion is in practical chart terms
- Recognise stretched price versus healthy trend movement
- Separate cleaner reversion conditions from dangerous fades
- Use location and context to improve reversion analysis
- Avoid treating every extended move as an automatic reversal
Apply oscillators properly by using them to read stretch, exhaustion, and market condition in context.
Objectives
- Understand what Stochastic, CCI, and Williams %R are measuring
- Use oscillators to support chart context rather than replace it
- Recognise stretch and exhaustion more effectively
- Separate trend continuation conditions from reversion conditions
- Avoid simplistic oscillator signals without technical context
Learn how RSI can be used to read momentum condition, shift, and possible weakness rather than as a simplistic signal tool.
Objectives
- Understand RSI beyond basic overbought and oversold ideas
- Use RSI to judge momentum condition and possible shift
- Recognise when RSI behaves differently in trends and ranges
- Combine RSI with price action and structure
- Avoid reducing RSI to one-click trading signals
Build on momentum analysis by using Bollinger Bands to identify stretch, squeezes, and volatility expansion conditions.
Objectives
- Use Bollinger Bands to recognise compression and expansion
- Identify stretch and squeeze conditions more clearly
- Understand how volatility affects setup quality
- Combine volatility clues with structure and momentum context
- Improve timing by reading volatility behaviour more practically
Learn how to compare markets, sectors, or shares to identify technical leadership and laggards.
Objectives
- Understand what relative strength and weakness mean on charts
- Compare markets, sectors, or shares more effectively
- Recognise leadership and laggards in a technical way
- Use comparison work to improve chart selection
- Add a market-selection layer to technical analysis
Turn relative strength work into a practical process for finding charts with stronger technical potential.
Objectives
- Build a cleaner technical watchlist process
- Use chart quality and leadership clues for selection
- Filter weaker opportunities out earlier
- Focus attention on charts with stronger technical potential
- Improve preparation by narrowing attention more effectively
Learn how the opening phase of a market session can shape chart quality, false starts, and early technical opportunity.
Objectives
- Understand why opening range behaviour matters
- Recognise early momentum versus false starts
- Use session structure to improve chart context
- Separate cleaner early opportunity from opening noise
- Add time-of-day awareness to technical analysis
Here's What You Get with your Traders Blueprint Membership Every Month
Each month includes one beginner session and one intermediate session, allowing members to first understand the core concept and then learn how that same concept applies to real chart analysis.
- One beginner-focused technical analysis session.
- One intermediate technical analysis session.
- A structured monthly topic that builds on the previous month.
- Practical chart examples showing clean versus poor-quality setups.
- A clear progression from basic chart reading to more advanced decision-making.
- Access to the relevant recordings and resources included in the Traders Blueprint membership.
Educational content only. Trading involves risk. Secure payment via Payfast.
Your Trading Coaches

Pieter’s trading journey began in 2016 while studying for his BCom in Business Management, where a live trading group and automated systems sparked his passion for the markets.
By 2018, he was trading full-time — focusing on long-term trends and international equities. His approach is built on patience, strategic positioning, and the power of compounding returns.
At Traders Mastermind, Pieter shares these principles through targeted sessions, helping members apply proven strategies with confidence in real market conditions.

With over 20 years in the markets, Warren has traded it all — from stocks and indices to forex.
He’s trained hundreds of traders, served as Head Market Analyst for IG Markets, and shared his insights on CNBC Africa and leading radio stations.
From 2015 to 2024, Warren coached clients at Standard Bank Securities, running technical analysis webinars and workshops, while also contributing to ABSA Bank’s educational programs.
Today, he’s laser-focused on one thing: helping traders master the markets with proven strategies and clear, actionable training.
They fail because they’re operating without structure, feedback, or weekly accountability.
What’s the one thing you wish someone had taught you earlier in your trading journey?
Member Reviews
See what our members have to say and share your experience. Help others make informed decisions.
Verified Feedback
Real-World Insights
Your Voice Matters
Build your system.
Trade it with discipline.
You need one process, applied consistently.
The Technical Blueprint takes members through a step-by-step development process. is.
Each month includes one beginner session and one intermediate session, allowing members to first understand the core concept and then learn how that same concept applies to real chart analysis.
Your Technical Blueprint Membership Includes:
Each Session includes:
One beginner-focused technical analysis session.
One intermediate technical analysis session.
A structured monthly topic that builds on the previous month.
Practical chart examples showing clean versus poor-quality setups.
A clear progression from basic chart reading to more advanced decision-making.
Access to the relevant recordings and resources included in the chosen membership tier.
Educational content only. Trading involves risk. Secure payment via Payfast.